" ← All games
MIN
MIN
Sun Nov 22, 8:20 PM ET
Estadio Banorte

SF
SF
▶ Watch Game Simulation
LAST 5
W
W
W
W
W
LAST 5
W
W
W
W
W
Player Board
TEAM POS
SORT
Streak badges = consecutive games clearing ▲ over or missing ▼ under the line
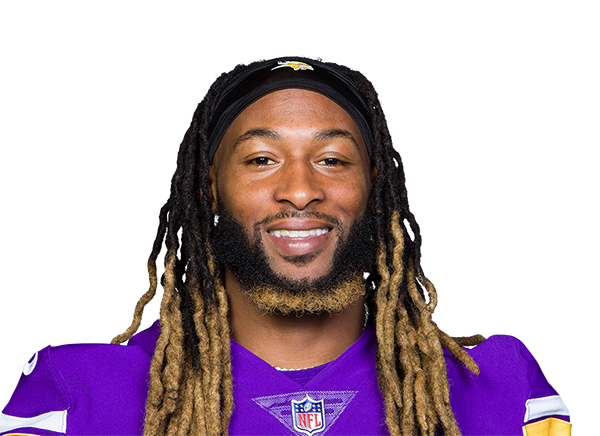
Kirk Cousins
QB2
Kirk Cousins
MIN · ↑ 100%
ACTIVE
Last out (W10 vs GB): 31 att, 21 comp, 207 pass yds, 2 TD, 1 INT; 3 rush att, 11 rush yds. Season high is 365 pass yds (W4); last 3 average 30 attempts and 223 yards a game (6 TD, 4 INT). pass attempts 44 → 26 → 32 → 31. pass yds 295 → 247 → 216 → 207. rush yds 6 → 3 → 0 → 11.
Pass TD
MARKET
8/10
W1-W6 OVER
1.5
LINE
2.2 (10g)
2026 AVG
76%
EDGE
GAMES
Loading...
Pass yds
MARKET
7/10
W1-W6 OVER
232.5
LINE
254.7 (10g)
2026 AVG
53%
EDGE
GAMES
Loading...
Rush att
MARKET
7/10
W1-W6 OVER
1.5
LINE
4▲ straight
2.5 (10g)
2026 AVG
56%
EDGE
GAMES
Loading...
Rush yds
MARKET
2/10
W1-W6 OVER
5.5
LINE
1.8 (10g)
2026 AVG
66%
EDGE
GAMES
Loading...
Anytime TD
MARKET
2/10
TDS/GAMES
7%
MODEL
2/10
2026 TD
25
EDGE
GAMES
Loading...
Aaron Jones
RB1
Aaron Jones
MIN · Rush 16→47 ↑ 194%
ACTIVE
Last out (W10 vs GB): 11 carries, 47 rush yds, 1 rush TD; 1 rec (1 tgt), 8 rec yds. Season rushing high is 113 yds (W5). Scored in 3 of 9 games (3 TD total). carries 8 → 5 → 5 → 11. rush yds 26 → 22 → 16 → 47. targets 1 → 2 → 1 → 1.
Rush yds
MARKET
6/9
W1-W6 OVER
30.5
LINE
57.9 (9g)
2026 AVG
53%
EDGE
GAMES
Loading...
Rec
MARKET
4/9
W1-W6 OVER
1.5
LINE
1.9 (9g)
2026 AVG
51%
EDGE
GAMES
Loading...
Rec yds
MARKET
3/9
W1-W6 OVER
10.5
LINE
11.4 (9g)
2026 AVG
62%
EDGE
GAMES
Loading...
Anytime TD
MARKET
3/9
TDS/GAMES
25%
MODEL
3/9
2026 TD
25
EDGE
GAMES
Loading...
Rush att
MARKET
6/9
W1-W6 OVER
8.5
LINE
14.0 (9g)
2026 AVG
50%
EDGE
GAMES
Loading...
Jordan Mason
RB2
Jordan Mason
MIN · Rec 7→0 ↓ 100%
ACTIVE
Last out (W10 vs GB): 16 carries, 59 rush yds; 0 rec (1 tgt), 0 rec yds. Season rushing high is 68 yds (W7). Scored in 1 of 5 games (1 TD total). carries 15 → 8 → 6 → 16. rush yds 68 → 20 → 35 → 59. targets 2 → 0 → 3 → 1.
Rec yds
MARKET
1/5
W1-W6 OVER
0.5
LINE
1.4 (5g)
2026 AVG
55%
EDGE
GAMES
Loading...
Rec
MARKET
1/5
W1-W6 OVER
0.5
LINE
0.4 (5g)
2026 AVG
56%
EDGE
GAMES
Loading...
Rush yds
MARKET
3/5
W1-W6 OVER
46.5
LINE
48.2 (5g)
2026 AVG
65%
EDGE
GAMES
Loading...
Rush att
MARKET
3/5
W1-W6 OVER
12.5
LINE
12.0 (5g)
2026 AVG
61%
EDGE
GAMES
Loading...
Anytime TD
MARKET
1/5
TDS/GAMES
23%
MODEL
1/5
2026 TD
25
EDGE
GAMES
Loading...
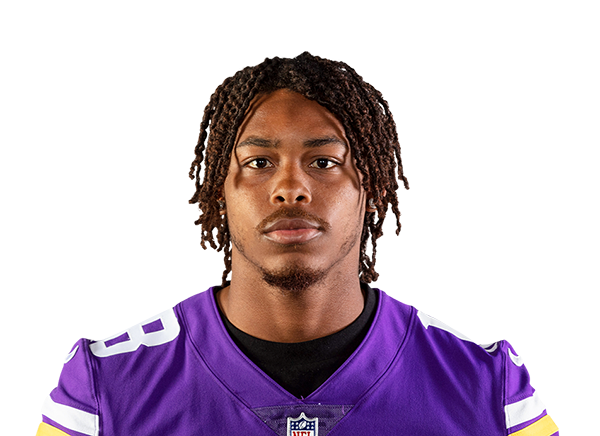
Justin Jefferson
WR3
Justin Jefferson
MIN · Rec 58→74 ↑ 28%
ACTIVE
Injury: QUESTIONABLE Last out (W10 vs GB): 13 targets, 9 catches, 74 yards. Season high is 92 yards (W1). Targets are climbing - 6 a game early, 11 over the last 3. 4 receiving TDs on the season. targets 7 → 9 → 11 → 13. rec 4 → 5 → 3 → 9. rec yds 44 → 33 → 58 → 74.
Anytime TD
MARKET
3/8
TDS/GAMES
34%
MODEL
3/8
2026 TD
-6%
EDGE
Book 150 (40%)
H2H vs SF: 1/1
GAMES
Loading...
Rec yds
MARKET
1/8
W1-W6 OVER
83
LINE
7▼ straight
58.4 (8g)
2026 AVG
62%
EDGE
GAMES
Loading...
Rec
MARKET
2/8
W1-W6 OVER
7.5
LINE
5.0 (8g)
2026 AVG
58%
EDGE
GAMES
Loading...
Rush yds
MARKET
-
W1-W6 OVER
0.5
LINE
-
2026 AVG
—
EDGE
GAMES
Loading...
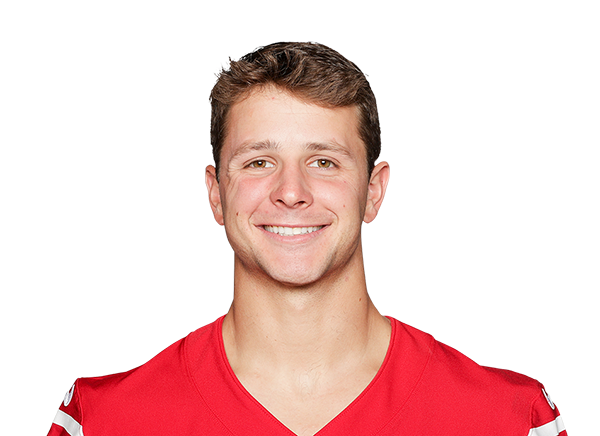
Brock Purdy
QB1
Brock Purdy
SF · Pass 232→389 ↑ 68%
ACTIVE
Injury: — Last out (W10 vs DAL): 28 att, 22 comp, 389 pass yds, 3 TD; 2 rush att, 21 rush yds. That 389 is his season high - last 3 average 31 attempts and 303 yards a game (6 TD, 3 INT). pass attempts 29 → 40 → 25 → 28. pass yds 264 → 288 → 232 → 389. rush yds 28 → 5 → 40 → 21.
Pass yds
MARKET
5/9
W1-W6 OVER
244.5
LINE
263.2 (9g)
2026 AVG
74%
EDGE
GAMES
Loading...
Pass INT
MARKET
4/9
W1-W6 OVER
0.5
LINE
0.6 (9g)
2026 AVG
50%
EDGE
GAMES
Loading...
Rush yds
MARKET
7/9
W1-W6 OVER
16.5
LINE
24.7 (9g)
2026 AVG
69%
EDGE
GAMES
Loading...
Pass TD
MARKET
7/9
W1-W6 OVER
1.5
LINE
2.2 (9g)
2026 AVG
59%
EDGE
GAMES
Loading...
Rush att
MARKET
5/8
W1-W6 OVER
3.5
LINE
4.9 (8g)
2026 AVG
61%
EDGE
GAMES
Loading...
Anytime TD
MARKET
2/9
TDS/GAMES
6%
MODEL
2/9
2026 TD
25
EDGE
GAMES
Loading...
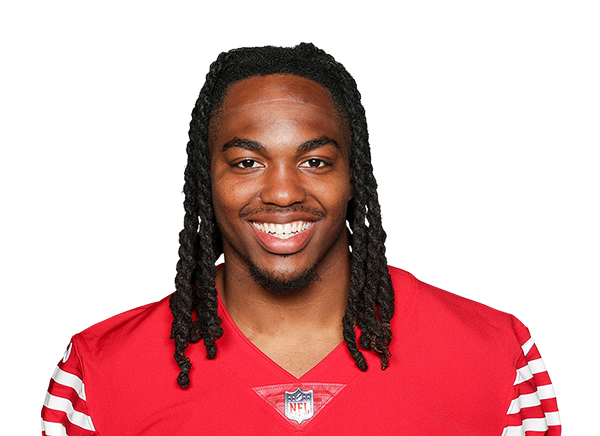
Christian McCaffrey
RB1
Christian McCaffrey
SF · Rush 68→62 ↓ 9%
ACTIVE
Injury: — Last out (W10 vs DAL): 13 carries, 62 rush yds, 1 rush TD; 4 rec (4 tgt), 161 rec yds. Season rushing high is 75 yds (W3). Scored in 8 of 9 games (13 TD total). carries 16 → 7 → 18 → 13. rush yds 64 → 39 → 68 → 62. targets 10 → 7 → 3 → 4.
Rush yds
MARKET
7/9
W1-W6 OVER
49.5
LINE
57.7 (9g)
2026 AVG
59%
EDGE
GAMES
Loading...
Rec
MARKET
6/9
W1-W6 OVER
3.5
LINE
4.4 (9g)
2026 AVG
67%
EDGE
GAMES
Loading...
Rec yds
MARKET
5/9
W1-W6 OVER
33.5
LINE
47.9 (9g)
2026 AVG
52%
EDGE
GAMES
Loading...
Anytime TD
MARKET
5/9
TDS/GAMES
44%
MODEL
5/9
2026 TD
-23%
EDGE
Book -200 (67%)
H2H vs MIN: 1/1
GAMES
Loading...
Rush att
MARKET
4/8
W1-W6 OVER
12.5
LINE
12.8 (8g)
2026 AVG
51%
EDGE
GAMES
Loading...
Kaelon Black
RB2
Kaelon Black
SF · Rec 0→13 → 0%
ACTIVE
Last out (W10 vs DAL): 11 carries, 53 rush yds, 1 rush TD; 2 rec (2 tgt), 13 rec yds. Season rushing high is 70 yds (W9). Scored in 2 of 9 games (2 TD total). carries 8 → 12 → 11 → 11. rush yds 34 → 63 → 70 → 53. targets 1 → 3 → 0 → 2.
Rec yds
MARKET
3/9
W1-W6 OVER
0.5
LINE
1.9 (9g)
2026 AVG
61%
EDGE
GAMES
Loading...
Rec
MARKET
4/9
W1-W6 OVER
0.5
LINE
0.6 (9g)
2026 AVG
60%
EDGE
GAMES
Loading...
Rush yds
MARKET
5/9
W1-W6 OVER
26.5
LINE
4▲ straight
39.6 (9g)
2026 AVG
61%
EDGE
GAMES
Loading...
Rush att
MARKET
4/8
W1-W6 OVER
7.5
LINE
3▲ straight
8.5 (8g)
2026 AVG
64%
EDGE
GAMES
Loading...
Anytime TD
MARKET
2/9
TDS/GAMES
25%
MODEL
2/9
2026 TD
25
EDGE
GAMES
Loading...
Deebo Samuel Sr.
WR1
Deebo Samuel Sr.
SF · Rec 21→31 ↑ 48%
ACTIVE
Last out (W10 vs DAL): 3 targets, 3 catches, 31 yards and a TD. Season high is 80 yards (W3). 4 receiving TDs on the season. targets 0 → 6 → 3 → 3. rec 0 → 5 → 2 → 3. rec yds 80 → 26 → 21 → 31.
Rec yds
MARKET
2/6
W1-W6 OVER
32.5
LINE
3▼ straight
39.5 (6g)
2026 AVG
65%
EDGE
GAMES
Loading...
Rec
MARKET
4/6
W1-W6 OVER
2.5
LINE
3.2 (6g)
2026 AVG
56%
EDGE
GAMES
Loading...
Rush yds
MARKET
-
W1-W6 OVER
14.5
LINE
-
2026 AVG
—
EDGE
GAMES
Loading...
Rush att
MARKET
2/6
W1-W6 OVER
2.5
LINE
2.0 (6g)
2026 AVG
67%
EDGE
GAMES
Loading...
Anytime TD
MARKET
3/6
TDS/GAMES
45%
MODEL
3/6
2026 TD
+9%
EDGE
Book 175 (36%)
H2H vs MIN: 0/2
GAMES
Loading...
Demarcus Robinson
WR2
Demarcus Robinson
SF · Rec 34→22 ↓ 35%
ACTIVE
Last out (W10 vs DAL): 0 targets, 0 catches, 0 yards. Season high is 50 yards (W1). 1 receiving TD on the season. targets 3 → 3 → 4 → 0. rec 2 → 3 → 3 → 0. rec yds 50 → 34 → 22 → 0.
Rec yds
MARKET
2/3
W1-W6 OVER
31.5
LINE
35.3 (3g)
2026 AVG
59%
EDGE
GAMES
Loading...
Rec
MARKET
2/3
W1-W6 OVER
2.5
LINE
2.7 (3g)
2026 AVG
54%
EDGE
GAMES
Loading...
Anytime TD
MARKET
1/3
TDS/GAMES
32%
MODEL
1/3
2026 TD
25
EDGE
GAMES
Loading...
Jordan Watkins
WR3
Jordan Watkins
SF · Rec 86→49 ↓ 43%
ACTIVE
Last out (W10 vs DAL): 3 targets, 2 catches, 49 yards. Season high is 86 yards (W9). Targets are climbing - 1 a game early, 4 over the last 3. 1 receiving TD on the season. targets 1 → 6 → 4 → 3. rec 1 → 3 → 4 → 2. rec yds 22 → 56 → 86 → 49.
Rec yds
MARKET
4/5
W1-W6 OVER
24.5
LINE
3▲ straight
54.6 (5g)
2026 AVG
55%
EDGE
GAMES
Loading...
Rec
MARKET
4/5
W1-W6 OVER
1.5
LINE
3▲ straight
2.4 (5g)
2026 AVG
58%
EDGE
GAMES
Loading...
Anytime TD
MARKET
1/5
TDS/GAMES
30%
MODEL
1/5
2026 TD
25
EDGE
GAMES
Loading...
Keenan Allen
WR4
Keenan Allen
SF · Rec 26→61 ↑ 135%
ACTIVE
Last out (W10 vs DAL): 7 targets, 5 catches, 61 yards. Season high is 82 yards (W6). 1 receiving TD on the season. targets 3 → 7 → 8 → 7. rec 3 → 7 → 4 → 5. rec yds 31 → 67 → 26 → 61.
Rec yds
MARKET
5/9
W1-W6 OVER
38.5
LINE
45.8 (9g)
2026 AVG
62%
EDGE
GAMES
Loading...
Rec
MARKET
7/9
W1-W6 OVER
3.5
LINE
3▲ straight
5.0 (9g)
2026 AVG
60%
EDGE
GAMES
Loading...
Anytime TD
MARKET
1/9
TDS/GAMES
27%
MODEL
1/9
2026 TD
25
EDGE
GAMES
Loading...
George Kittle
TE1
George Kittle
SF · Rec 58→74 ↑ 28%
ACTIVE
Injury: QUESTIONABLE Last out (W10 vs DAL): 9 targets, 6 catches, 74 yards. Season high is 88 yards (W7). Targets are climbing - 5 a game early, 9 over the last 3. 5 receiving TDs on the season. targets 8 → 10 → 7 → 9. rec 5 → 8 → 4 → 6. rec yds 69 → 88 → 58 → 74.
Rec yds
MARKET
6/9
W1-W6 OVER
64.5
LINE
61.9 (9g)
2026 AVG
71%
EDGE
GAMES
Loading...
Rec
MARKET
3/9
W1-W6 OVER
5.5
LINE
4.9 (9g)
2026 AVG
58%
EDGE
GAMES
Loading...
Anytime TD
MARKET
4/9
TDS/GAMES
35%
MODEL
4/9
2026 TD
-8%
EDGE
Book 135 (43%)
H2H vs MIN: 1/2
GAMES
Loading...
Luke Farrell
TE2
Luke Farrell
SF · Rec 19→14 ↓ 26%
ACTIVE
Last out (W10 vs DAL): 0 targets, 0 catches, 0 yards. Season high is 19 yards (W1). Still scoreless in 2026. targets 0 → 1 → 1 → 0. rec 0 → 1 → 0 → 0. rec yds 0 → 14 → 0 → 0.
Rec yds
MARKET
2/2
W1-W6 OVER
0.5
LINE
16.5 (2g)
2026 AVG
76%
EDGE
GAMES
Loading...
Anytime TD
MARKET
0/2
TDS/GAMES
30%
MODEL
0/2
2026 TD
25
EDGE
GAMES
Loading...

← Back to all games

MIN @ SF · SUN NOV 22 · 8:20 PM ET
LANE VISION
Aaron Jones
RB · Minnesota Vikings · vs SF
126
CARRIES
7.9%
LE
#15
14.3%
LT
#9
11.1%
LG
#12
24.6%
C
#7
18.3%
RG
#21
15.1%
RT
#1
8.7%
RE
#9
LANE FIT 18% TOUGH
AVOIDC · #7RT · #1

82% of his volume runs at SF's ordinary-or-better lanes - the soft spots are not where he lives. His best opening is right guard at #21 (18.3% of his runs) - softer than average, not a leak. The middle (#7) and right tackle (#1) are traps. One catch: SF kills the big run in his lanes - only 4% of carries there break 10+ (league 9%), so the ceiling is capped even when the floor holds.

PROP LENSHis rushing over has to be earned - the map gives him no cheap lane, so raw volume, not efficiency, has to carry it.

Full lane table
LaneHis shareHis YPCOpp rankExplosive %Stuff %Opp faced
LE7.9%3.8#157.6%18.0%12
LT14.3%3.61#98.7%14.5%15
LG11.1%2.36#124.8%15.2%26
C24.6%3.87#71.9%12.9%87
RG18.3%3.09#213.9%16.9%35
RT15.1%6.21#14.3%20.6%13
RE8.7%6.91#98.0%11.7%22

Explosive % = share of runs in that lane breaking 10+ yards against this defence; Stuff % = share stopped at or behind the line. Both shrunk toward league average like the ranks.

RECEIPTSLEAD BACKS VS SF AVERAGE 54 YDS · LINED 9x: 0 CLEARED IT
How lead backs did vs SF
WkBackCarYdsLineResult
Wk 10Javonte Williams (DAL)166363.5UNDER -0.5
Wk 9Ashton Jeanty (LV)62528.5UNDER -3.5
Wk 7Bijan Robinson (ATL)206381.5UNDER -18.5
Wk 6Rachaad White (WSH)72727.5UNDER -0.5
Wk 5Emanuel Wilson (SEA)206162.5UNDER -1.5
Wk 4J.K. Dobbins (DEN)114058.5UNDER -18.5
Wk 3Jeremiyah Love (ARI)219090.5UNDER -0.5
Wk 2De'Von Achane (MIA)207474.5UNDER -0.5
Wk 1Kyren Williams (LAR)114147.5UNDER -6.5

Line = his posted rushing line for that game: FanDuel's number, from our own pregame pull that week or SportsGameOdds' closing record; a dash means no book line was archived for him that week (usually a backup who took over the game). Lead back = most carries in that game, which can differ from the pregame starter.

Christian McCaffrey
RB · San Francisco 49ers · vs MIN
115
CARRIES
11.3%
LE
#2
12.2%
LT
#32
15.7%
LG
#13
35.7%
C
#13
13.0%
RG
#22
5.2%
RT
#16
7.0%
RE
#2
LANE FIT 25% TOUGH
EXPLOITLT · 12% OF RUNSAVOIDLE · #2RE · #2

75% of his volume runs at MIN's ordinary-or-better lanes - the soft spots are not where he lives. The opening is left tackle: 12.2% of his runs at 5.36 a carry against MIN's #32 lane. Left end (#2) and right end (#2) are traps.

PROP LENSHis rushing over gets its help from left tackle - if SF feeds those lanes early, the map says the plan is working.

Full lane table
LaneHis shareHis YPCOpp rankExplosive %Stuff %Opp faced
LE11.3%4.08#29.7%26.2%28
LT12.2%5.36#3220.8%13.5%39
LG15.7%3.17#136.5%13.0%32
C35.7%4.88#139.2%18.3%53
RG13.0%4.0#226.1%10.2%35
RT5.2%4.5#169.5%11.3%32
RE7.0%5.88#219.0%32.2%14

Explosive % = share of runs in that lane breaking 10+ yards against this defence; Stuff % = share stopped at or behind the line. Both shrunk toward league average like the ranks.

RECEIPTSLEAD BACKS VS MIN AVERAGE 73 YDS · LINED 9x: 5 CLEARED IT
How lead backs did vs MIN
WkBackCarYdsLineResult
Wk 10Kaleb Johnson (GB)104229.5OVER +12.5
Wk 9James Cook (BUF)3110780.5OVER +26.5
Wk 8Jahmyr Gibbs (DET)24153130.5OVER +22.5
Wk 7Jonathan Taylor (IND)189595.5UNDER -0.5
Wk 5Kendre Miller (NO)103023.5OVER +6.5
Wk 4Ollie Gordon II (MIA)910023.5OVER +76.5
Wk 3Bucky Irving (TB)154653.5UNDER -7.5
Wk 2D'Andre Swift (CHI)164545.5UNDER -0.5
Wk 1MarShawn Lloyd (GB)133744.5UNDER -7.5

Line = his posted rushing line for that game: FanDuel's number, from our own pregame pull that week or SportsGameOdds' closing record; a dash means no book line was archived for him that week (usually a backup who took over the game). Lead back = most carries in that game, which can differ from the pregame starter.

Lane Fit = share of his runs aimed at the defence's softer half of lanes (ranks 17-32). Rings: green = attack (rank 25-32), red = avoid (1-8), steel = ordinary. Opponent lane ranks are sample-shrunk toward the league lane average before ranking, so thin samples are pulled in. Run lanes from play-by-play run location and gap, season to date.
Market & Matchup
SPREAD
SF -3
MIN +3 · DraftKings
TOTAL
46.5
Over / Under
MONEYLINE
SF -162
MIN +136
MODEL
Sim projects MIN 20.1 - SF 22.9 - SF wins it 58% of sims, agreeing with the market favorite.
MONEY
The spread money is split from the tickets: 51% of spread money is on SF - on just 21% of tickets.
RECORD
Situational ATS records unavailable today - TeamRankings blocked the records pull.
Where the money is · one bar, tickets vs money
Spread · SF -3
MIN 79%
SF 21%
TICKETS
MIN 49%
SF 51%
MONEY
Total · 46.5
OVER 11%
UNDER 89%
TICKETS
OVER 11%
UNDER 89%
MONEY
Moneyline
MIN 10%
SF 90%
TICKETS
MIN 27%
SF 73%
MONEY
Key injuries
Minnesota Vikings
Kirk CousinsQBACTIVE
Aaron JonesRBACTIVE
Jordan MasonRBACTIVE
Justin JeffersonWRACTIVE
San Francisco 49ers
Brock PurdyQBACTIVE
Christian McCaffreyRBACTIVE
Kaelon BlackRBACTIVE
Deebo Samuel Sr.WRACTIVE
Jordan WatkinsWRACTIVE
Top props in this game · model edge
Kirk Cousins QB · MIN
Over 1.5 pass td
Over in 8/10 games (avg 2.2) - SF allows 2.03 pass TDs a game to QBs (#32)
76%
MODEL
Luke Farrell TE · SF
Over 0.5 rec yds
Over in 2/2 games (avg 16.5) - MIN allows 42.1 receiving yards a game to TEs (#3)
76%
MODEL
Brock Purdy QB · SF
Over 244.5 pass yds
Over in 5/9 games (avg 263.2) - MIN allows 182.5 pass yards a game to QBs (#2)
74%
MODEL
George Kittle TE · SF
Over 64.5 rec yds
Over in 6/9 games (avg 61.9) - MIN allows 42.1 receiving yards a game to TEs (#3)
71%
MODEL
No player on this page is out, so nobody had to be excluded from this strip.
Matchup edges · 2026 season ranks
MIN ball vs SF defense

The crack: 63.0 TE yards a game (#27) and 247.6 QB yards a game (#24).

The wall: 73.2 rush yards a game (#5) and 151.4 WR yards a game (#21).

SF ball vs MIN defense

The crack: 109.6 rush yards a game (#25) and 42.1 TE yards a game (#3).

The wall: 182.5 QB yards a game (#2) and 118.6 WR yards a game (#2).

Line: DraftKings via ESPN · Splits: Action Network · Model: 10,000-game simulation · Injuries: Tuesday report
Defensive Matchup Ratings
SF defense
faces MIN
vs QB
#28
#24 247.6 yds/gm
#32 2.03 td/gm
vs RB
#4
#5 73.2 yds/gm
#3 0.33 td/gm
vs WR
#25
#21 151.4 yds/gm
#29 12.5 rec/gm
vs TE
#29
#27 63.0 yds/gm
#31 6.4 rec/gm
MIN defense
faces SF
vs QB
#2
#2 182.5 yds/gm
#1 0.7 td/gm
vs RB
#19
#25 109.6 yds/gm
#13 0.66 td/gm
vs WR
#5
#2 118.6 yds/gm
#8 9.8 rec/gm
vs TE
#2
#3 42.1 yds/gm
#2 3.9 rec/gm