" ← All games
IND
IND
Thu Nov 19, 8:15 PM ET
Reliant Stadium

HOU
HOU
▶ Watch Game Simulation
LAST 5
L
L
W
W
L
LAST 5
L
L
L
L
W
Player Board
TEAM POS
SORT
Streak badges = consecutive games clearing ▲ over or missing ▼ under the line
Daniel Jones
QB1
Daniel Jones
IND · Pass 180→108 ↓ 40%
ACTIVE
Last out (W10 vs MIA): 22 att, 11 comp, 108 pass yds, 1 TD, 2 INT; 5 rush att, 9 rush yds. Season high is 269 pass yds (W6); last 3 average 28 attempts and 144 yards a game (3 TD, 5 INT). He faces a Washington defense he hasn't played in 2024–2026. pass attempts 22 → 28 → 34 → 22. pass yds 108 → 144 → 180 → 108. rush yds 13 → 7 → 11 → 9.
Pass yds
MARKET
4/10
W1-W6 OVER
185.5
LINE
4▼ straight
183.0 (10g)
2026 AVG
62%
EDGE
GAMES
Loading...
Pass INT
MARKET
9/10
W1-W6 OVER
0.5
LINE
5▲ straight
1.2 (10g)
2026 AVG
71%
EDGE
GAMES
Loading...
Pass TD
MARKET
7/10
W1-W6 OVER
0.5
LINE
3▲ straight
0.7 (10g)
2026 AVG
66%
EDGE
GAMES
Loading...
Rush yds
MARKET
4/10
W1-W6 OVER
9.5
LINE
9.5 (10g)
2026 AVG
52%
EDGE
GAMES
Loading...
Rush att
MARKET
4/10
W1-W6 OVER
3.5
LINE
3.3 (10g)
2026 AVG
60%
EDGE
GAMES
Loading...
Anytime TD
MARKET
1/10
TDS/GAMES
5%
MODEL
1/10
2026 TD
25
EDGE
GAMES
Loading...
Jonathan Taylor
RB1
Jonathan Taylor
IND · Rush 46→83 ↑ 80%
ACTIVE
Last out (W10 vs MIA): 16 carries, 83 rush yds; 2 rec (4 tgt), 20 rec yds. Season rushing high is 98 yds (W1). Scored in 5 of 10 games (8 TD total). carries 18 → 8 → 13 → 16. rush yds 95 → 23 → 46 → 83. targets 3 → 5 → 5 → 4.
Rush yds
MARKET
7/10
W1-W6 OVER
51.5
LINE
73.9 (10g)
2026 AVG
60%
EDGE
GAMES
Loading...
Rec
MARKET
3/10
W1-W6 OVER
3.5
LINE
2.8 (10g)
2026 AVG
54%
EDGE
GAMES
Loading...
Rec yds
MARKET
5/10
W1-W6 OVER
20
LINE
24.0 (10g)
2026 AVG
53%
EDGE
GAMES
Loading...
Anytime TD
MARKET
5/10
TDS/GAMES
47%
MODEL
5/10
2026 TD
-23%
EDGE
Book -235 (70%)
H2H vs HOU: 3/5
GAMES
Loading...
Rush att
MARKET
9/10
W1-W6 OVER
12.5
LINE
17.7 (10g)
2026 AVG
73%
EDGE
GAMES
Loading...
Seth McGowan
RB2
Seth McGowan
IND · Rec -3→0 ↓ 100%
ACTIVE
Last out (W10 vs MIA): 12 carries, 77 rush yds, 1 rush TD. That 77 rushing is a season high. Scored in 2 of 10 games (2 TD total). carries 11 → 5 → 6 → 12. rush yds 46 → 29 → 45 → 77. targets 1 → 0 → 1 → 0.
Rec yds
MARKET
3/9
W1-W6 OVER
0.5
LINE
3▼ straight
1.0 (9g)
2026 AVG
55%
EDGE
GAMES
Loading...
Rec
MARKET
5/9
W1-W6 OVER
0.5
LINE
0.6 (9g)
2026 AVG
61%
EDGE
GAMES
Loading...
Rush yds
MARKET
5/9
W1-W6 OVER
28.5
LINE
4▲ straight
31.7 (9g)
2026 AVG
55%
EDGE
GAMES
Loading...
Rush att
MARKET
2/10
W1-W6 OVER
7.5
LINE
5.5 (10g)
2026 AVG
70%
EDGE
GAMES
Loading...
Anytime TD
MARKET
2/9
TDS/GAMES
25%
MODEL
2/9
2026 TD
25
EDGE
GAMES
Loading...
Ashton Dulin
WR1
Ashton Dulin
IND · Rec 55→30 ↓ 45%
ACTIVE
Last out (W10 vs MIA): 2 targets, 1 catches, 30 yards. Season high is 55 yards (W9). 1 receiving TD on the season. targets 0 → 0 → 2 → 2. rec 0 → 0 → 1 → 1. rec yds 0 → 0 → 55 → 30.
Rec yds
MARKET
3/4
W1-W6 OVER
19.5
LINE
28.5 (4g)
2026 AVG
64%
EDGE
GAMES
Loading...
Rec
MARKET
1/4
W1-W6 OVER
1.5
LINE
3▼ straight
1.2 (4g)
2026 AVG
57%
EDGE
GAMES
Loading...
Anytime TD
MARKET
1/4
TDS/GAMES
35%
MODEL
1/4
2026 TD
+24%
EDGE
Book 850 (11%)
H2H vs HOU: 1/3
GAMES
Loading...
Josh Downs
WR2
Josh Downs
IND · Rec 24→53 ↑ 121%
ACTIVE
Last out (W10 vs MIA): 5 targets, 4 catches, 53 yards and a TD. Season high is 77 yards (W3). Targets have cooled - 8 a game early, 5 over the last 3. 2 receiving TDs on the season. targets 4 → 5 → 6 → 5. rec 2 → 4 → 3 → 4. rec yds 18 → 23 → 24 → 53.
Rec yds
MARKET
6/10
W1-W6 OVER
33.5
LINE
40.7 (10g)
2026 AVG
57%
EDGE
GAMES
Loading...
Rec
MARKET
5/10
W1-W6 OVER
3.5
LINE
3.7 (10g)
2026 AVG
62%
EDGE
GAMES
Loading...
Anytime TD
MARKET
2/10
TDS/GAMES
23%
MODEL
2/10
2026 TD
25
EDGE
GAMES
Loading...
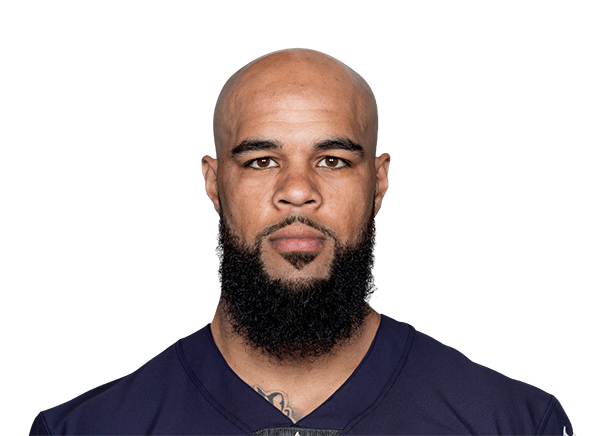
Keenan Allen
WR3
Keenan Allen
IND · Rec 26→61 ↑ 135%
ACTIVE
Last out (W10 vs MIA): 7 targets, 5 catches, 61 yards. Season high is 82 yards (W6). 1 receiving TD on the season. targets 3 → 7 → 8 → 7. rec 3 → 7 → 4 → 5. rec yds 31 → 67 → 26 → 61.
Rec yds
MARKET
5/9
W1-W6 OVER
37
LINE
45.8 (9g)
2026 AVG
53%
EDGE
GAMES
Loading...
Rec
MARKET
6/9
W1-W6 OVER
4.5
LINE
5.0 (9g)
2026 AVG
69%
EDGE
GAMES
Loading...
Anytime TD
MARKET
1/9
TDS/GAMES
24%
MODEL
1/9
2026 TD
25
EDGE
GAMES
Loading...
Laquon Treadwell
WR4
Laquon Treadwell
IND · Rec 18→24 ↑ 33%
ACTIVE
Last out (W10 vs MIA): 3 targets, 3 catches, 24 yards and a TD. Season high is 61 yards (W2). 1 receiving TD on the season. targets 2 → 2 → 1 → 3. rec 2 → 1 → 0 → 3. rec yds 19 → 18 → 0 → 24.
Rec yds
MARKET
3/8
W1-W6 OVER
29.5
LINE
4▼ straight
29.9 (8g)
2026 AVG
55%
EDGE
GAMES
Loading...
Rec
MARKET
3/8
W1-W6 OVER
2.5
LINE
2.4 (8g)
2026 AVG
58%
EDGE
GAMES
Loading...
Anytime TD
MARKET
1/8
TDS/GAMES
22%
MODEL
1/8
2026 TD
25
EDGE
GAMES
Loading...
Anthony Gould
WR5
Anthony Gould
IND · Rec 16→28 ↑ 75%
QUESTIONABLE
Last out (W10 vs MIA): 4 targets, 2 catches, 28 yards. That 28 is a season high. Still scoreless in 2026. targets 0 → 0 → 1 → 4. rec 0 → 0 → 1 → 2. rec yds 0 → 0 → 16 → 28.
Rec yds
MARKET
1/2
W1-W6 OVER
23.5
LINE
22.0 (2g)
2026 AVG
54%
EDGE
GAMES
Loading...
Rec
MARKET
0/2
W1-W6 OVER
2.5
LINE
5▼ straight
1.5 (2g)
2026 AVG
53%
EDGE
GAMES
Loading...
Anytime TD
MARKET
0/2
TDS/GAMES
29%
MODEL
0/2
2026 TD
25
EDGE
GAMES
Loading...
Deion Burks
WR6
Deion Burks
IND · Rec 2→0 ↓ 100%
ACTIVE
Last out (W10 vs MIA): 2 targets, 0 catches, 0 yards. Season high is 41 yards (W6). Still scoreless in 2026. targets 1 → 1 → 1 → 2. rec 1 → 1 → 1 → 0. rec yds 11 → 2 → 0 → 0.
Rec yds
MARKET
1/6
W1-W6 OVER
18.5
LINE
3▼ straight
10.0 (6g)
2026 AVG
64%
EDGE
GAMES
Loading...
Rec
MARKET
1/6
W1-W6 OVER
1.5
LINE
3▼ straight
1.0 (6g)
2026 AVG
51%
EDGE
GAMES
Loading...
Anytime TD
MARKET
0/6
TDS/GAMES
18%
MODEL
0/6
2026 TD
25
EDGE
GAMES
Loading...
Tyler Warren
TE2
Tyler Warren
IND · Rec 44→1 ↓ 98%
ACTIVE
Last out (W10 vs MIA): 3 targets, 2 catches, 1 yards. Season high is 83 yards (W5). 2 receiving TDs on the season. targets 9 → 10 → 7 → 3. rec 7 → 4 → 4 → 2. rec yds 83 → 18 → 44 → 1.
Rec yds
MARKET
3/8
W1-W6 OVER
42
LINE
34.5 (8g)
2026 AVG
62%
EDGE
GAMES
Loading...
Rec
MARKET
3/8
W1-W6 OVER
5.5
LINE
3▼ straight
5.0 (8g)
2026 AVG
54%
EDGE
GAMES
Loading...
Anytime TD
MARKET
2/8
TDS/GAMES
29%
MODEL
2/8
2026 TD
25
EDGE
GAMES
Loading...
C.J. Stroud
QB1
C.J. Stroud
HOU · Pass 384→211 ↓ 45%
ACTIVE
Last out (W10 vs CLE): 38 att, 20 comp, 211 pass yds, 3 TD, 1 INT; 3 rush att, 20 rush yds. Season high is 384 pass yds (W9); last 3 average 34 attempts and 249 yards a game (10 TD, 2 INT). His only prior meeting with Dallas (2024) also came without a TD pass. pass attempts 34 → 28 → 35 → 38. pass yds 312 → 153 → 384 → 211. rush yds 5 → 4 → 20 → 20.
Pass yds
MARKET
5/9
W1-W6 OVER
263.5
LINE
273.6 (9g)
2026 AVG
54%
EDGE
GAMES
Loading...
Pass TD
MARKET
6/9
W1-W6 OVER
1.5
LINE
4▲ straight
2.1 (9g)
2026 AVG
67%
EDGE
GAMES
Loading...
Rush yds
MARKET
5/9
W1-W6 OVER
11.5
LINE
13.3 (9g)
2026 AVG
63%
EDGE
GAMES
Loading...
Pass INT
MARKET
3/9
W1-W6 OVER
0.5
LINE
0.3 (9g)
2026 AVG
57%
EDGE
GAMES
Loading...
Rush att
MARKET
3/9
W1-W6 OVER
2.5
LINE
2.6 (9g)
2026 AVG
53%
EDGE
GAMES
Loading...
Anytime TD
MARKET
1/9
TDS/GAMES
5%
MODEL
1/9
2026 TD
25
EDGE
GAMES
Loading...
Nico Collins
WR1
Nico Collins
HOU · Rec 55→94 ↑ 71%
ACTIVE
Last out (W10 vs CLE): 16 targets, 9 catches, 94 yards and a TD. Season high is 118 yards (W4). 5 receiving TDs on the season. targets 5 → 5 → 4 → 16. rec 3 → 2 → 4 → 9. rec yds 74 → 6 → 55 → 94.
Rec yds
MARKET
4/7
W1-W6 OVER
68.5
LINE
68.3 (7g)
2026 AVG
53%
EDGE
GAMES
Loading...
Rec
MARKET
3/7
W1-W6 OVER
4.5
LINE
4.3 (7g)
2026 AVG
60%
EDGE
GAMES
Loading...
Anytime TD
MARKET
3/7
TDS/GAMES
37%
MODEL
3/7
2026 TD
-7%
EDGE
Book 125 (44%)
H2H vs IND: 3/4
GAMES
Loading...
Tank Dell
WR2
Tank Dell
HOU · Rec 105→21 ↓ 80%
ACTIVE
Last out (W10 vs CLE): 4 targets, 3 catches, 21 yards. Season high is 105 yards (W9). 1 receiving TD on the season. targets 1 → 9 → 4. rec 1 → 4 → 3. rec yds 43 → 105 → 21.
Rec yds
MARKET
2/3
W1-W6 OVER
34.5
LINE
56.3 (3g)
2026 AVG
56%
EDGE
GAMES
Loading...
Rec
MARKET
2/3
W1-W6 OVER
2.5
LINE
2.7 (3g)
2026 AVG
63%
EDGE
GAMES
Loading...
Anytime TD
MARKET
1/3
TDS/GAMES
42%
MODEL
1/3
2026 TD
+17%
EDGE
Book 300 (25%)
H2H vs IND: 2/3
GAMES
Loading...
Xavier Hutchinson
WR3
Xavier Hutchinson
HOU · Rec 29→58 ↑ 100%
ACTIVE
Last out (W10 vs CLE): 9 targets, 4 catches, 58 yards and a TD. Season high is 65 yards (W5). 3 receiving TDs on the season. targets 3 → 6 → 5 → 9. rec 2 → 3 → 3 → 4. rec yds 10 → 17 → 29 → 58.
Rec yds
MARKET
4/9
W1-W6 OVER
40.5
LINE
38.3 (9g)
2026 AVG
60%
EDGE
GAMES
Loading...
Rec
MARKET
2/9
W1-W6 OVER
3.5
LINE
3.1 (9g)
2026 AVG
50%
EDGE
GAMES
Loading...
Anytime TD
MARKET
3/9
TDS/GAMES
29%
MODEL
3/9
2026 TD
25
EDGE
GAMES
Loading...
Kayshon Boutte
WR4
Kayshon Boutte
HOU · Rec 25→125 ↑ 400%
ACTIVE
Last out (W10 vs CLE): 1 targets, 0 catches, 0 yards. Season high is 125 yards (W9). 2 receiving TDs on the season. targets 3 → 2 → 5 → 1. rec 2 → 1 → 4 → 0. rec yds 16 → 25 → 125 → 0.
Rec yds
MARKET
4/8
W1-W6 OVER
26.5
LINE
39.9 (8g)
2026 AVG
51%
EDGE
GAMES
Loading...
Rec
MARKET
4/8
W1-W6 OVER
2.5
LINE
2.4 (8g)
2026 AVG
57%
EDGE
GAMES
Loading...
Anytime TD
MARKET
0/8
TDS/GAMES
16%
MODEL
0/8
2026 TD
25
EDGE
GAMES
Loading...
Dalton Schultz
TE1
Dalton Schultz
HOU · Rec 42→11 ↓ 74%
ACTIVE
Last out (W10 vs CLE): 2 targets, 1 catches, 11 yards and a TD. Season high is 140 yards (W2). Targets have cooled - 8 a game early, 4 over the last 3. 1 receiving TD on the season. targets 6 → 6 → 4 → 2. rec 4 → 5 → 2 → 1. rec yds 33 → 45 → 42 → 11.
Rec yds
MARKET
5/9
W1-W6 OVER
30.5
LINE
41.7 (9g)
2026 AVG
51%
EDGE
GAMES
Loading...
Rec
MARKET
4/9
W1-W6 OVER
3.5
LINE
4.0 (9g)
2026 AVG
56%
EDGE
GAMES
Loading...
Anytime TD
MARKET
1/9
TDS/GAMES
16%
MODEL
1/9
2026 TD
25
EDGE
GAMES
Loading...

← Back to all games

IND @ HOU · THU NOV 19 · 8:15 PM ET
LANE VISION
Jonathan Taylor
RB · Indianapolis Colts · vs HOU
175
CARRIES
9.7%
LE
#4
13.7%
LT
#1
15.4%
LG
#25
17.1%
C
#22
8.0%
RG
#24
21.7%
RT
#11
14.3%
RE
#26
LANE FIT 55% MIXED
EXPLOITLG · 15% OF RUNSRE · 14% OF RUNSAVOIDLE · #4LT · #1

His map is split - 55% of his runs go at HOU's softer half, the rest into defended lanes. The opening is left guard: 15.4% of his runs at 3.81 a carry against HOU's #25 lane. Left end (#4) and left tackle (#1) are traps.

PROP LENSHis rushing over gets its help from left guard and right end - if IND feeds those lanes early, the map says the plan is working.

Full lane table
LaneHis shareHis YPCOpp rankExplosive %Stuff %Opp faced
LE9.7%3.76#411.5%28.0%22
LT13.7%6.33#14.5%21.7%16
LG15.4%3.81#2511.0%10.4%33
C17.1%2.73#227.1%9.2%72
RG8.0%4.5#248.1%10.0%36
RT21.7%3.84#118.3%18.7%26
RE14.3%5.0#2614.7%15.3%21

Explosive % = share of runs in that lane breaking 10+ yards against this defence; Stuff % = share stopped at or behind the line. Both shrunk toward league average like the ranks.

RECEIPTSLEAD BACKS VS HOU AVERAGE 64 YDS · LINED 9x: 5 CLEARED IT
How lead backs did vs HOU
WkBackCarYdsLineResult
Wk 10Quinshon Judkins (CLE)103843.5UNDER -5.5
Wk 9Omarion Hampton (LAC)136037.5OVER +22.5
Wk 7Cam Skattebo (NYG)1712431.5OVER +92.5
Wk 6Bhayshul Tuten (JAX)123939.5UNDER -0.5
Wk 5Tony Pollard (TEN)145250.5OVER +1.5
Wk 4Javonte Williams (DAL)196259.5OVER +2.5
Wk 3Jonathan Taylor (IND)236870.5UNDER -2.5
Wk 2Chase Brown (CIN)208082.5UNDER -2.5
Wk 1James Cook (BUF)135747.5OVER +9.5

Line = his posted rushing line for that game: FanDuel's number, from our own pregame pull that week or SportsGameOdds' closing record; a dash means no book line was archived for him that week (usually a backup who took over the game). Lead back = most carries in that game, which can differ from the pregame starter.

Emari Demercado
RB · Houston Texans · vs IND
18
CARRIES
5.6%
LE
#30
5.6%
LT
#27
22.2%
LG
#32
27.8%
C
#19
11.1%
RG
#19
27.8%
RT
#25
0.0%
RE
#12
LANE FIT 100% STRONG
EXPLOITRT · 28% OF RUNSLG · 22% OF RUNS

Four of every five carries aim at IND's softer half of lanes. The opening is right tackle: 27.8% of his runs at 3.0 a carry against IND's #25 lane. No lane he uses with any volume is a IND strength - there is no avoid on his map.

PROP LENSHis rushing over gets its help from right tackle and left guard - if HOU feeds those lanes early, the map says the plan is working.

Full lane table
LaneHis shareHis YPCOpp rankExplosive %Stuff %Opp faced
LE5.6%0.0#3024.2%12.4%30
LT5.6%0.0#2716.7%11.5%39
LG22.2%5.5#327.6%12.4%26
C27.8%2.0#194.6%14.9%74
RG11.1%0.0#199.6%14.4%29
RT27.8%3.0#2511.1%17.2%35
RE0.0%0.0#1210.4%17.6%34

Explosive % = share of runs in that lane breaking 10+ yards against this defence; Stuff % = share stopped at or behind the line. Both shrunk toward league average like the ranks.

RECEIPTSLEAD BACKS VS IND AVERAGE 84 YDS · LINED 10x: 7 CLEARED IT
How lead backs did vs IND
WkBackCarYdsLineResult
Wk 10Ollie Gordon II (MIA)207672.5OVER +3.5
Wk 9Javonte Williams (DAL)2010170.5OVER +30.5
Wk 8Bhayshul Tuten (JAX)16104122.5UNDER -18.5
Wk 7Jordan Mason (MIN)156863.5OVER +4.5
Wk 6Tony Pollard (TEN)197669.5OVER +6.5
Wk 5Jaylen Warren (PIT)1510173.5OVER +27.5
Wk 4Jacory Croskey-Merritt (WSH)91515.5UNDER -0.5
Wk 3David Montgomery (HOU)113335.5UNDER -2.5
Wk 2Kenneth Walker III (KC)2411782.5OVER +34.5
Wk 1Derrick Henry (BAL)24144135.5OVER +8.5

Line = his posted rushing line for that game: FanDuel's number, from our own pregame pull that week or SportsGameOdds' closing record; a dash means no book line was archived for him that week (usually a backup who took over the game). Lead back = most carries in that game, which can differ from the pregame starter.

Lane Fit = share of his runs aimed at the defence's softer half of lanes (ranks 17-32). Rings: green = attack (rank 25-32), red = avoid (1-8), steel = ordinary. Opponent lane ranks are sample-shrunk toward the league lane average before ranking, so thin samples are pulled in. Run lanes from play-by-play run location and gap, season to date.
Market & Matchup
SPREAD
HOU -12.5
IND +12.5 · DraftKings
TOTAL
44.5
Over / Under
MONEYLINE
HOU -700
IND +500
MODEL
Sim projects IND 21.2 - HOU 24.5 - HOU wins it 59% of sims, agreeing with the market favorite.
MONEY
The moneyline money is split from the tickets: 40% of moneyline money is on IND - on just 6% of tickets.
RECORD
Situational ATS records unavailable today - TeamRankings blocked the records pull.
Where the money is · one bar, tickets vs money
Spread · HOU -12.5
IND 40%
HOU 60%
TICKETS
IND 37%
HOU 63%
MONEY
Total · 44.5
OVER 74%
UNDER 26%
TICKETS
OVER 62%
UNDER 38%
MONEY
Moneyline
IND 6%
HOU 94%
TICKETS
IND 40%
HOU 60%
MONEY
Key injuries
Indianapolis Colts
Anthony GouldWR · Gould (toe) was estimated as limited in Monday's walkthroughQUES
Daniel JonesQBACTIVE
Jonathan TaylorRBACTIVE
Seth McGowanRBACTIVE
Josh DownsWRACTIVE
Houston Texans
C.J. StroudQBACTIVE
Nico CollinsWRACTIVE
Tank DellWRACTIVE
Xavier HutchinsonWRACTIVE
Kayshon BoutteWRACTIVE
Top props in this game · model edge
Jonathan Taylor RB · IND
Over 47% anytime TD
Over in 5/10 games (avg 5/10)
73%
MODEL
Daniel Jones QB · IND
Over 0.5 pass int
Over in 9/10 games (avg 1.2)
71%
MODEL
Seth McGowan RB · IND
Over 7.5 rush att
Over in 2/10 games (avg 5.5)
70%
MODEL
Keenan Allen WR · IND
Over 4.5 rec
Over in 6/9 games (avg 5.0) - HOU allows 11.1 receptions a game to WRs (#16)
69%
MODEL
No player on this page is out, so nobody had to be excluded from this strip.
Matchup edges · 2026 season ranks
IND ball vs HOU defense

The crack: 163.8 WR yards a game (#28) and 248.6 QB yards a game (#27).

The wall: 90.2 rush yards a game (#13) and 52.3 TE yards a game (#15).

HOU ball vs IND defense

The crack: 240.9 QB yards a game (#23) and 108.3 rush yards a game (#23).

The wall: 53.3 TE yards a game (#16) and 240.9 QB yards a game (#23).

Line: DraftKings via ESPN · Splits: Action Network · Model: 10,000-game simulation · Injuries: Tuesday report
Defensive Matchup Ratings
HOU defense
faces IND
vs QB
#18
#27 248.6 yds/gm
#9 1.35 td/gm
vs RB
#17
#13 90.2 yds/gm
#21 0.8 td/gm
vs WR
#22
#28 163.8 yds/gm
#16 11.1 rec/gm
vs TE
#16
#15 52.3 yds/gm
#17 5.2 rec/gm
IND defense
faces HOU
vs QB
#20
#23 240.9 yds/gm
#18 1.5 td/gm
vs RB
#20
#23 108.3 yds/gm
#18 0.76 td/gm
vs WR
#17
#23 155.3 yds/gm
#11 10.4 rec/gm
vs TE
#12
#16 53.3 yds/gm
#7 4.6 rec/gm